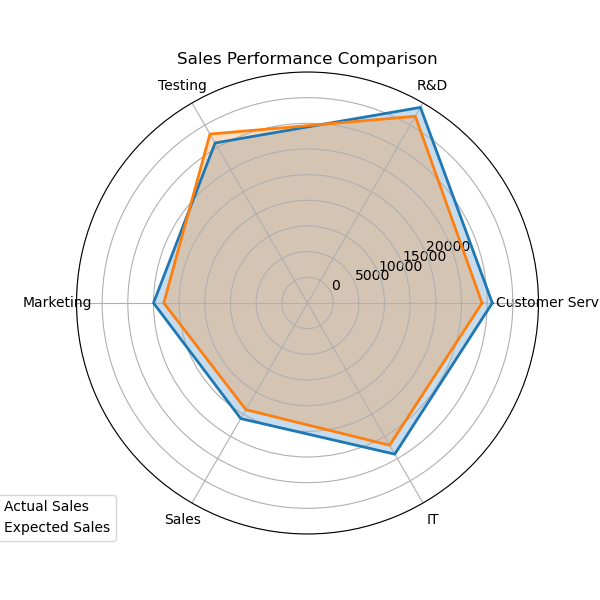
In this tutorial, we will learn how to create a radar chart (also known as a spider chart) using Python's Matplotlib library. Radar charts are used to visualize multivariate data, making them ideal for comparing performance across different categories.
First, ensure you have Matplotlib installed. You can install it using pip:
pip install matplotlib
Import the necessary libraries:
import numpy as np
import matplotlib.pyplot as plt
from math import piDefine the categories and the corresponding values for the radar chart:
categories = ['Customer Service', 'R&D', 'Testing', 'Marketing', 'Sales', 'IT']
n = len(categories)

values = [18000, 22000, 18000, 15000, 13000, 17000]
values2 = [17000, 21000, 19000, 14000, 12000, 16000]Convert the data into the correct format for the radar chart:
angles = [x * (2 * pi / n) for x in range(n)]
values += values[:1]  # back to origin
values2 += values2[:1]
angles += angles[:1]Create and customize the radar chart using Matplotlib:
fig, ax = plt.subplots(figsize=(6, 6), subplot_kw=dict(polar=True))
ax.plot(angles, values, linewidth=2, linestyle='solid', label='Actual Sales')
ax.fill(angles, values, alpha=0.25)

ax.plot(angles, values2, linewidth=2, linestyle='solid', label='Expected Sales')
ax.fill(angles, values2, alpha=0.25)

ax.set_xticks(angles[:-1])
ax.set_xticklabels(categories)

ax.set_yticklabels(['0', '5000', '10000', '15000', '20000'])

plt.legend(loc='upper right', bbox_to_anchor=(0.1, 0.1))
plt.title('Sales Performance Comparison')
plt.show()You have now created a radar chart in Python using Matplotlib. You can customize the chart further by adjusting the labels, colors, and other styling options to fit your specific needs.
